Welcome to our January Edition! Get a quick overview of India’s 24+ lakh active companies and this month’s incorporation trends across revenue bands and regions.
Key highlights:
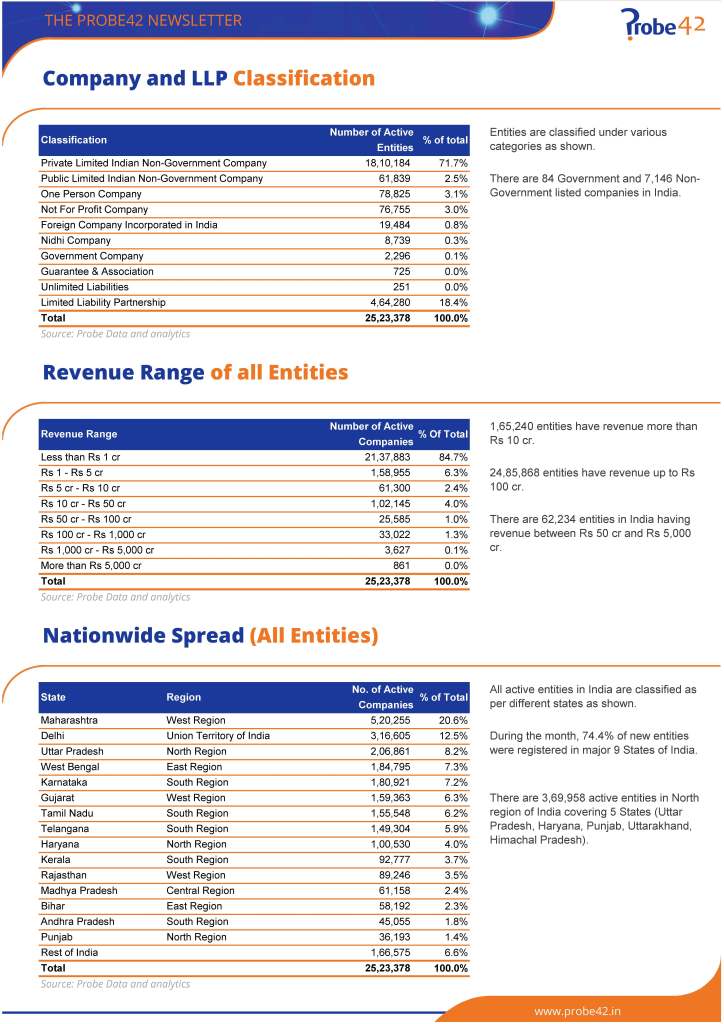
- Active Entities: 25.24 lakh companies and LLPs.
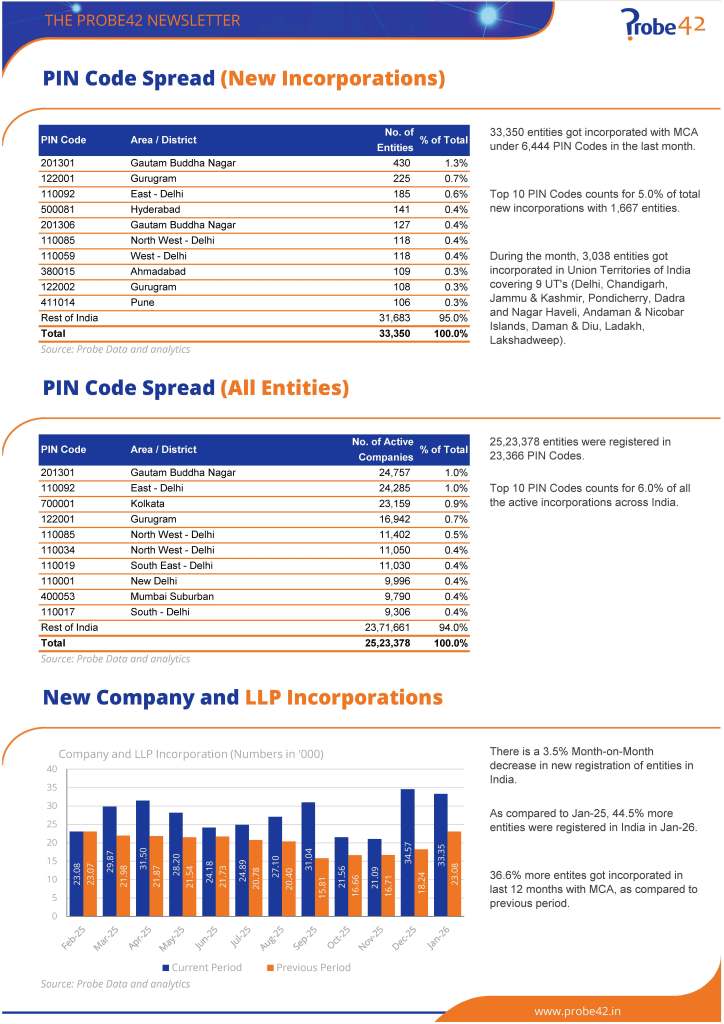
- New Incorporations (Jan 2026): 33,350 companies in 6,444 pincodes (vs 34,567 in 6,508 pincodes in December).
- Year-over-Year Growth: 36.6% more entities incorporated in the past 12 months (330.4k vs 241.9k) and 44.5% more in January 2026 vs January 2025.
- Active Directors (Jan-26): 33.11 lakh Indian, 62.4k foreign.
Region-wise Active Charges (as on 31-Jan-2026):
- North: 128.1k charges across 5 states (UP, Haryana, Punjab, Uttarakhand, Himachal Pradesh) – ₹30,61,425.0 crore total.
- West: 377.7k charges across 5 states (West Bengal, Bihar, Odisha, Jharkhand, Sikkim) – ₹1,75,71,697.4 crore total.
- South: 275.3k charges across 5 states (Karnataka, Tamil Nadu, Telangana, Kerala, Andhra Pradesh) – ₹78,38,654.0 crore total.
- East: 118.7k charges across 4 states (Maharashtra, Gujarat, Rajasthan, Goa) – ₹25,92,101.5 crore total.
- Central: 39.0k charges across 2 states (Madhya Pradesh, Chhattisgarh) – ₹6,63,282.7 crore total.
- North East: 9.3k charges across 7 states (Assam, Manipur, Tripura, Meghalaya, Arunachal Pradesh, Nagaland, Mizoram) – ₹1,33,929.5 crore total.
- Union Territories: 180.5k charges across 9 UTs (Delhi, Chandigarh, J&K, Pondicherry, DNH, Andaman & Nicobar, Daman & Diu, Ladakh, Lakshadweep) – ₹59,29,834.5 crore total.
Top 5 Industries (by total count):
Information Technology (1,30,700), Real Estate (1,15,700), BFSI (93,900), Manufacturing (69,900), Outsourcing (69,300).