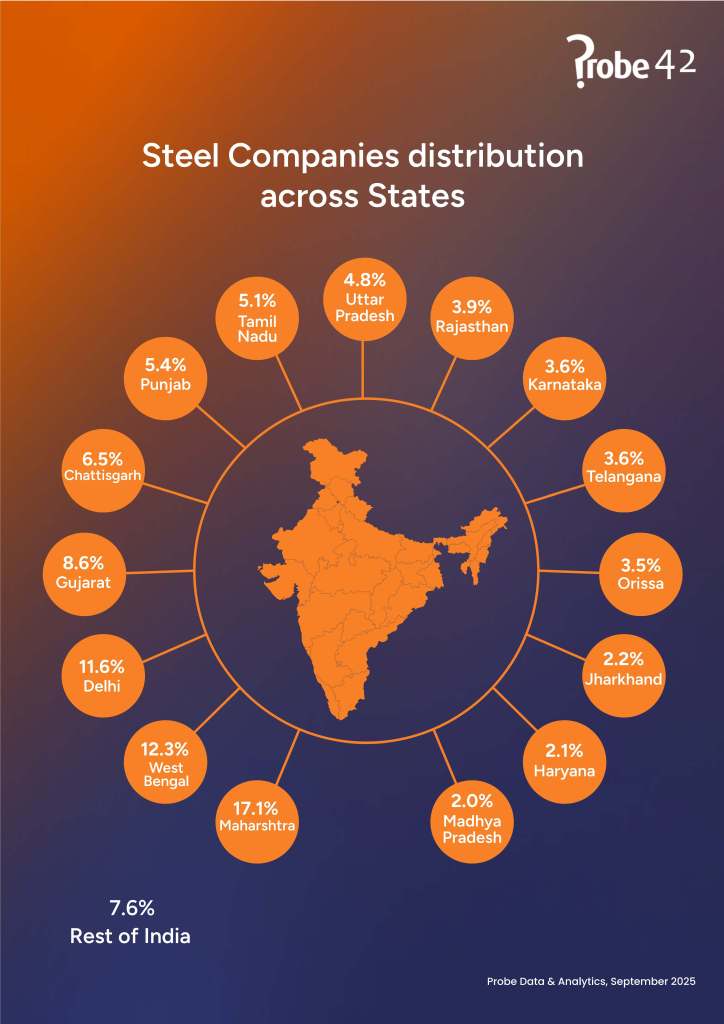
Welcome to our September Edition! Deep dive into India’s 23 lakh active companies, and analyse incorporation trends in India, including revenue, paid-up capital and geographical distributions. Plus, explore our Industry Insights feature on the Steel Sector, covering segments, companies
age, revenues, borrowings, and forex activity.
Key highlights:
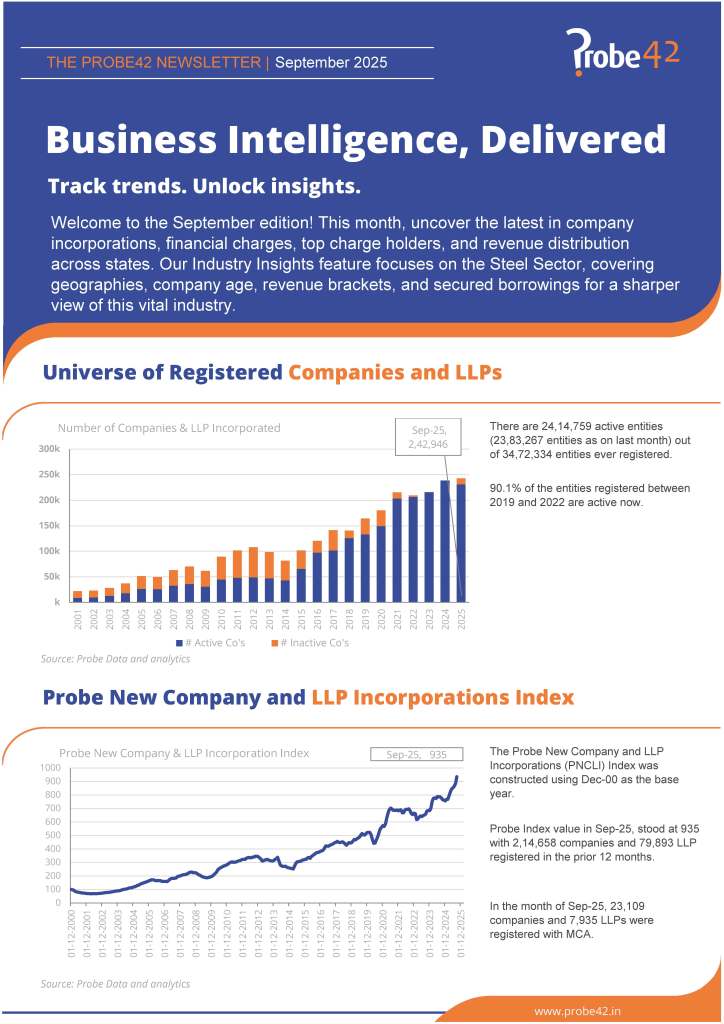
- Active Entities: 24.15 lakh companies and LLPs.
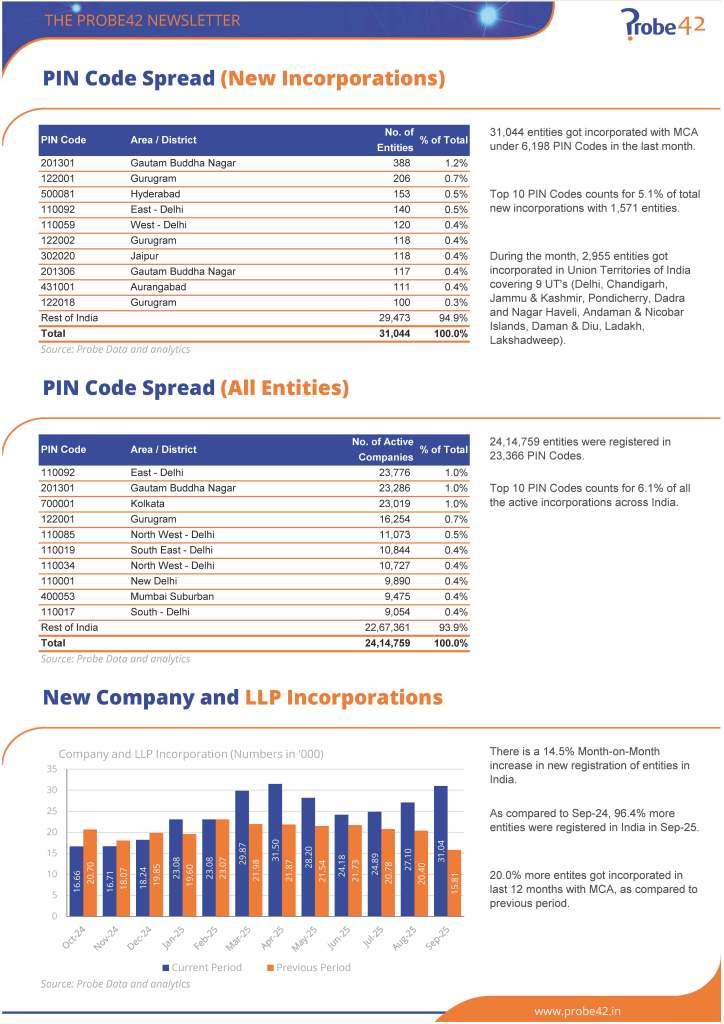
- New Incorporations (Sep 2025): 31,044 companies in 6,198 pincodes (vs 27,104 in 5,795 pincodes in August).
- Year-over-Year Growth: 20.0% more entities incorporated in the past 12 months (294.6k vs 245.4k) and 96.4% more in September 2025 vs September 2024.
- Active Directors (Sep-25): 31.52 lakh Indian, 60.7k foreign.
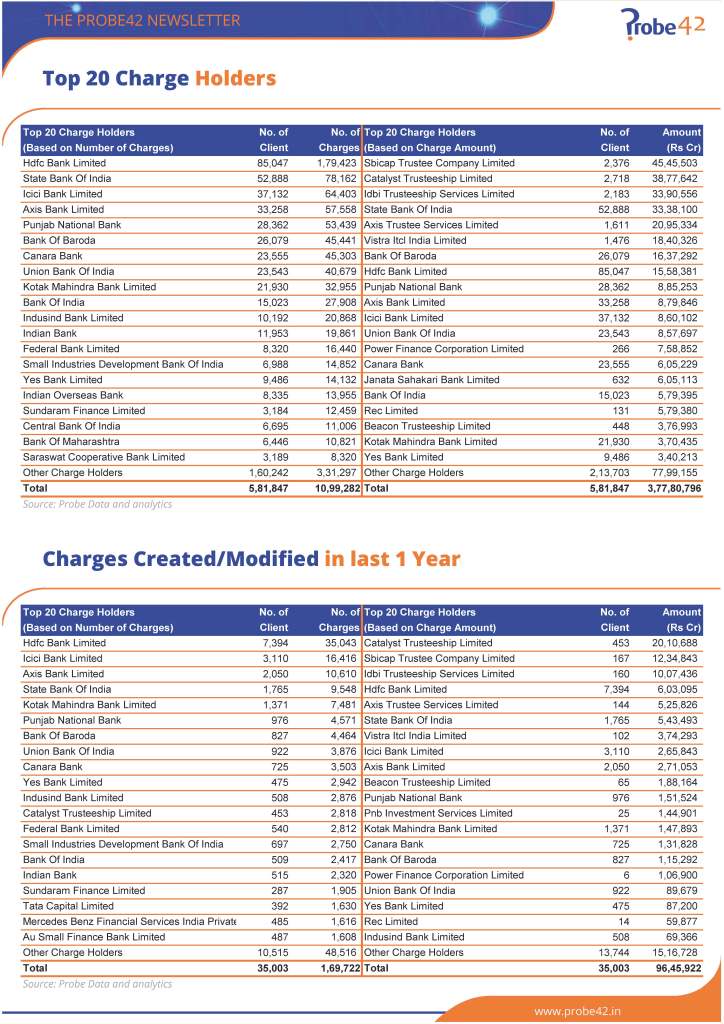
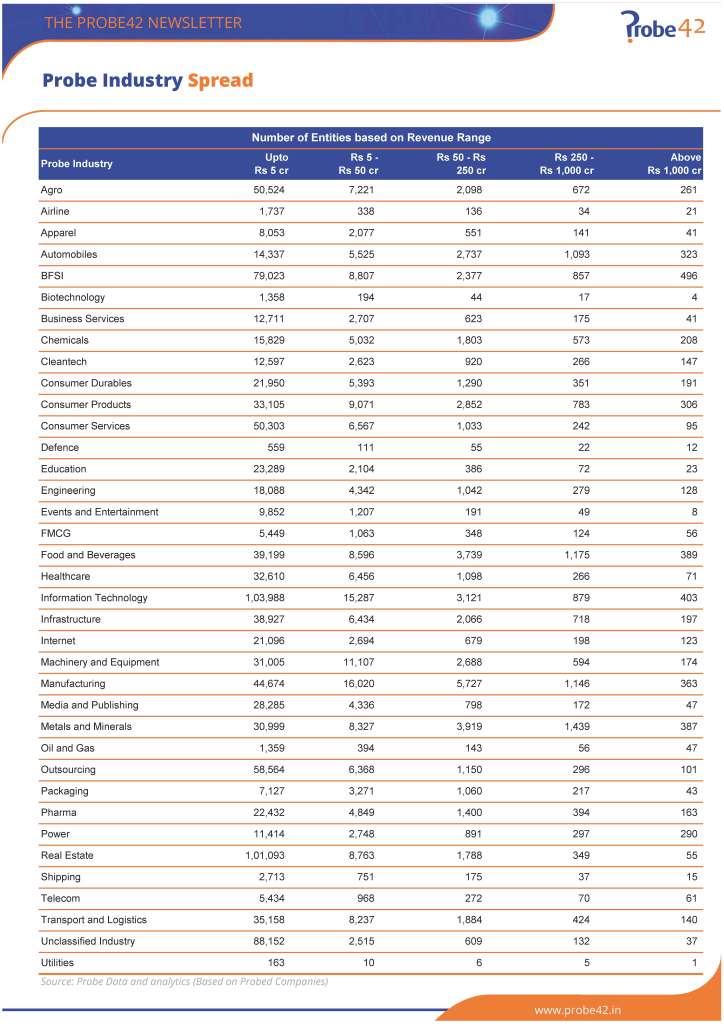
Top Probe Industries by Revenue Category:
- North: 122.9k charges across 5 states (UP, Haryana, Punjab, Uttarakhand, Himachal Pradesh) – ₹29,23,892.8 crore total.
- East: 116.1k charges across 4 states (Maharashtra, Gujarat, Rajasthan, Goa) – ₹25,16,461.6 crore total.
- South: 268.2k charges across 5 states (Karnataka, Tamil Nadu, Telangana, Kerala, Andhra Pradesh) – ₹76,33,039.4 crore total.
- West: 368.6k charges across 5 states (West Bengal, Bihar, Odisha, Jharkhand, Sikkim) – ₹1,81,02,473.9 crore total.
- Central: 37.9k charges across 2 states (Madhya Pradesh, Chhattisgarh) – ₹6,43,145.9 crore total.
- North East: 9.2k charges across 7 states (Assam, Manipur, Tripura, Meghalaya, Arunachal Pradesh, Nagaland, Mizoram) – ₹1,19,076.6 crore total.
- Union Territories: 176.6k charges across 9 UTs (Delhi, Chandigarh, J&K, Pondicherry, DNH, Andaman & Nicobar, Daman & Diu, Ladakh, Lakshadweep) – ₹58,42,706.7 crore total.