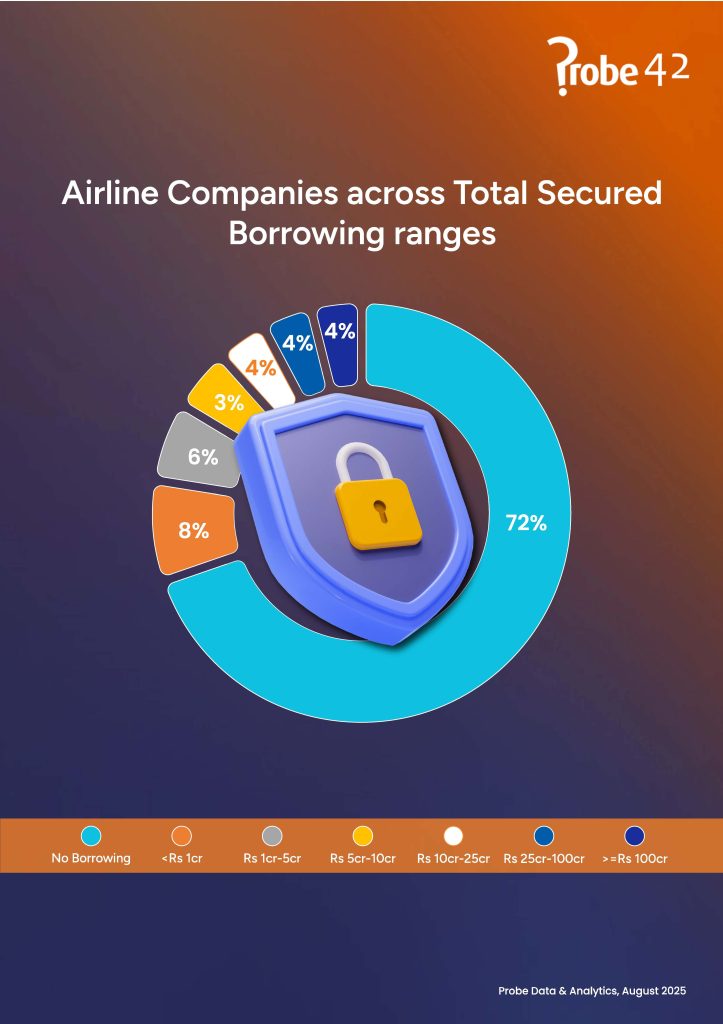
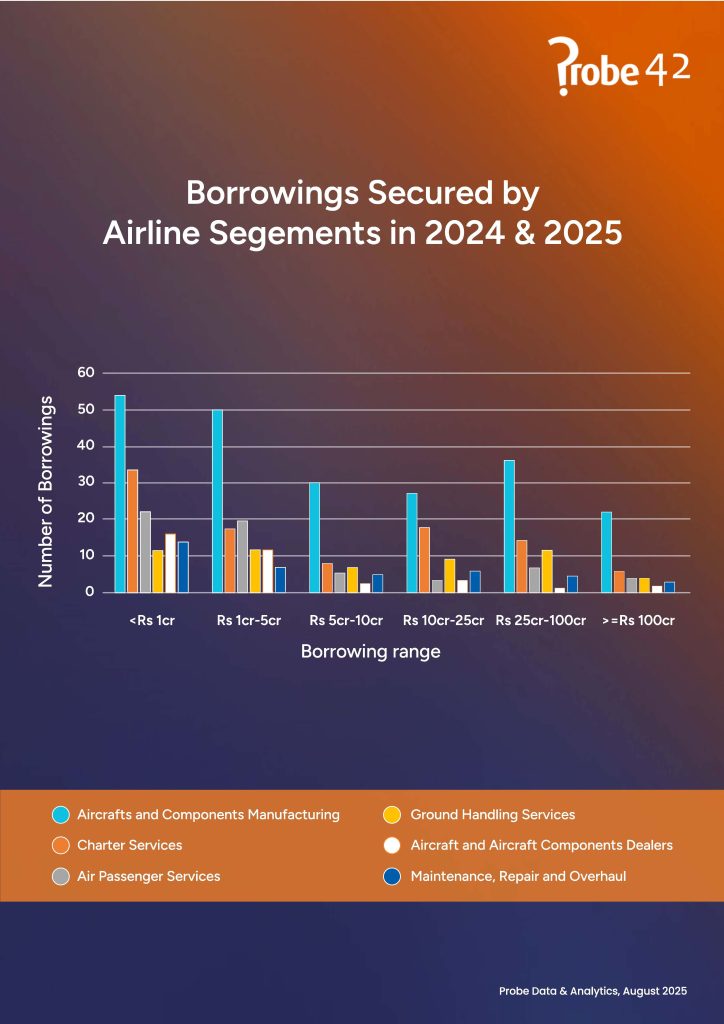
Welcome to our August Edition! Deep dive into India’s 23 Lakh active companies, and analyse incorporation trends in India, including revenue, paid-up capital and geographical distributions. Plus, explore our Industry Insights feature on the Airline Industry, covering segments, companies
age, revenues, borrowings, and forex activity.
Key highlights:
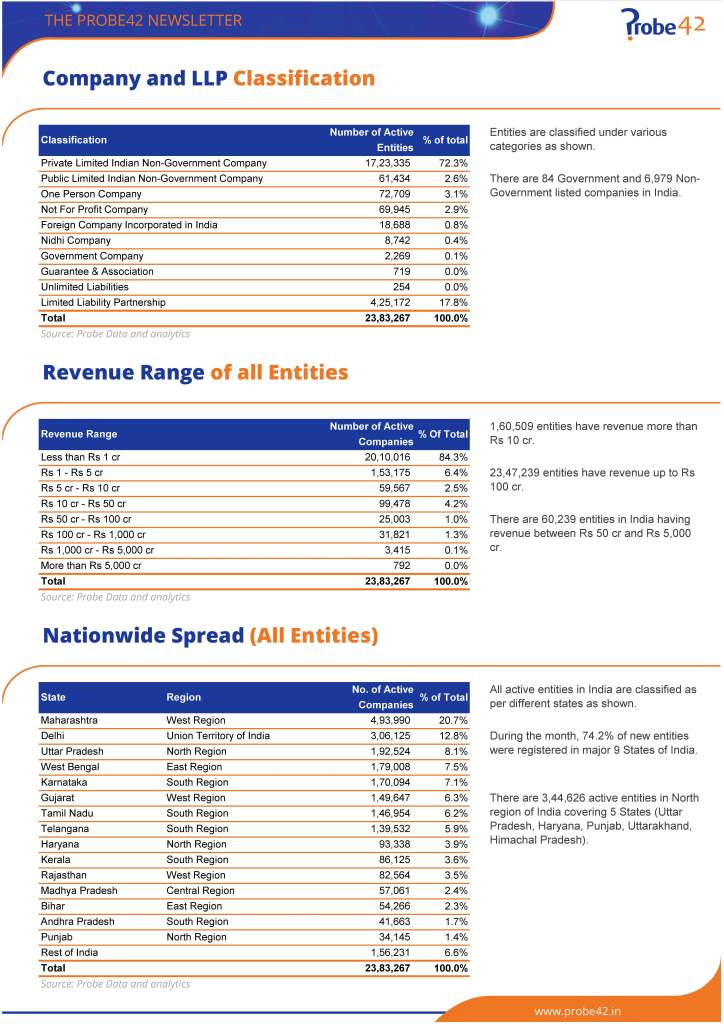
- Active Entities: 23.84 lakh companies and LLPs.
- New Incorporations (Aug 2025): 27,104 companies in 5,795 pincodes (vs 24,893 in 5,296 pincodes in July).
- Year-over-Year Growth: 12.7% more entities incorporated in the past 12 months (279.3k vs 247.9k) and 32.9% more in August 2025 vs August 2024.
Top Probe Industries by Revenue Category:
- Upto ₹5 cr: Information Technology (1,02,131), Real Estate (1,00,148), BFSI (78,509), Outsourcing (57,812), Consumer Services (49,385)
- ₹5–50 cr: Manufacturing (15,946), Information Technology (15,197), Machinery & Equipment (11,053), Consumer Products (9,007), BFSI (8,747)
- ₹50–250 cr: Manufacturing (5,715), Metals & Minerals (3,923), Food & Beverages (3,710), Information Technology (3,116), Consumer Products (2,842)
- ₹250–1,000 cr: Metals & Minerals (1,430), Food & Beverages (1,172), Manufacturing (1,137), Automobiles (1,085), Information Technology (872)
- Above ₹1,000 cr: BFSI (499), Information Technology (404), Food & Beverages (389), Metals & Minerals (384), Manufacturing (366)