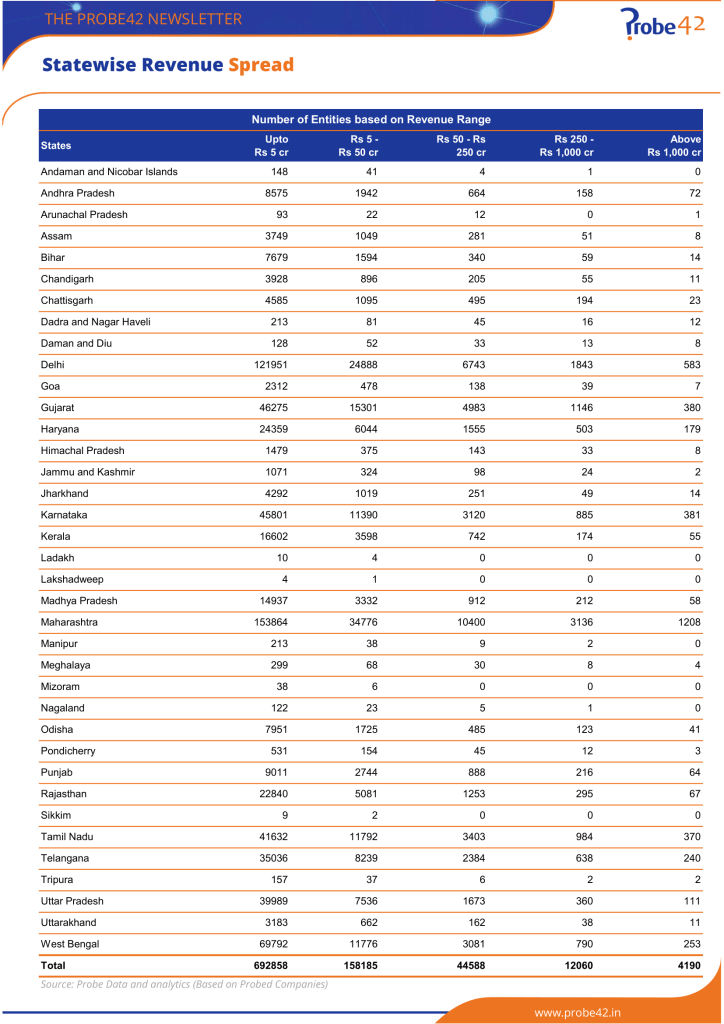
Welcome to our July Edition! Deep dive into India’s 23 Lakh active companies, and analyse incorporation trends in India, including revenue, paid-up capital and geographical distributions.
Key highlights:
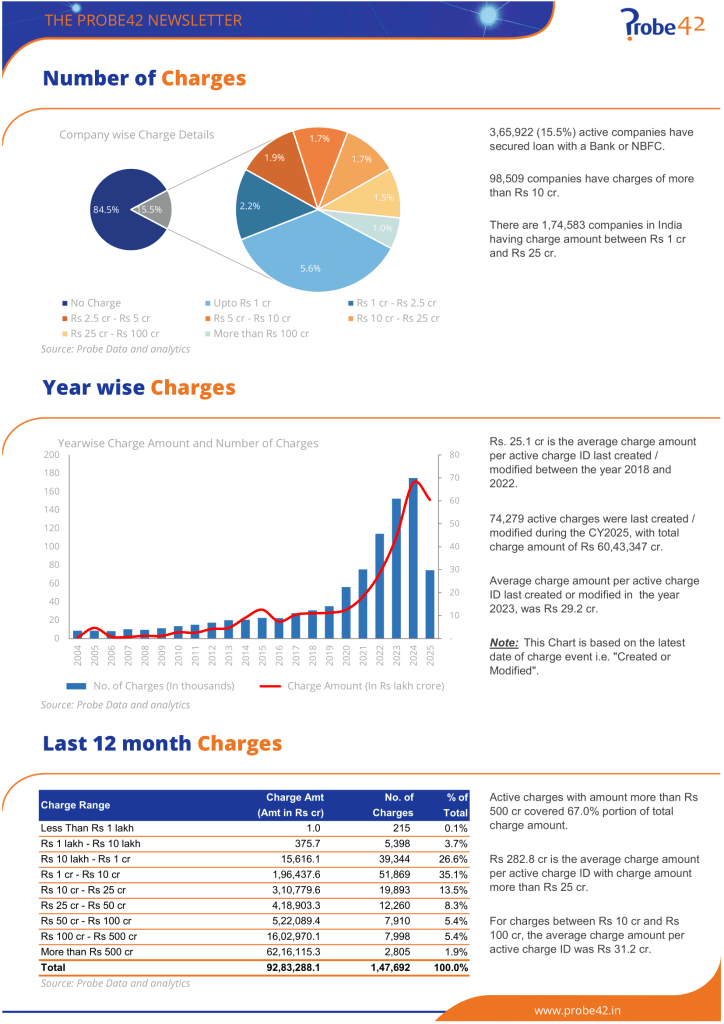
- Active Entities: 23.58 lakh companies and LLPs.
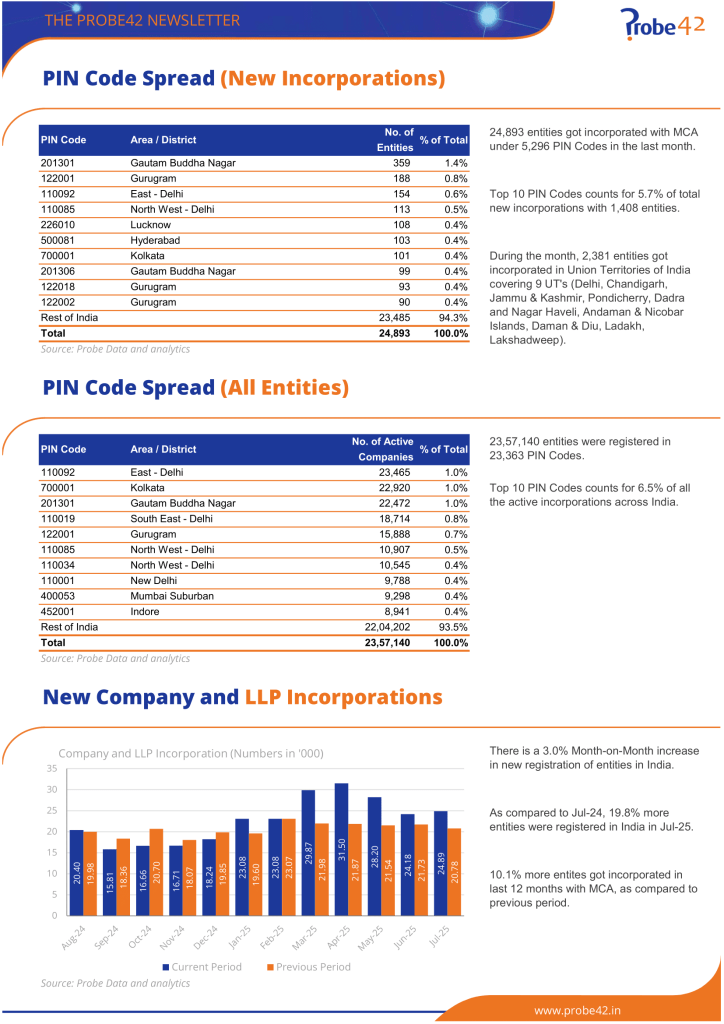
- New Incorporations (July 2025): 24,893 companies in 5,296 pincodes (vs 24,179 in 5,128 pincodes in June).
- Year-over-Year Growth: 10.1% more entities incorporated in the past 12 months (272.6k vs 247.5k) and 19.8% more in July 2025 vs July 2024.
- Active Directors (Jul-25): 30.54 lakh Indian, 58.6k foreign.
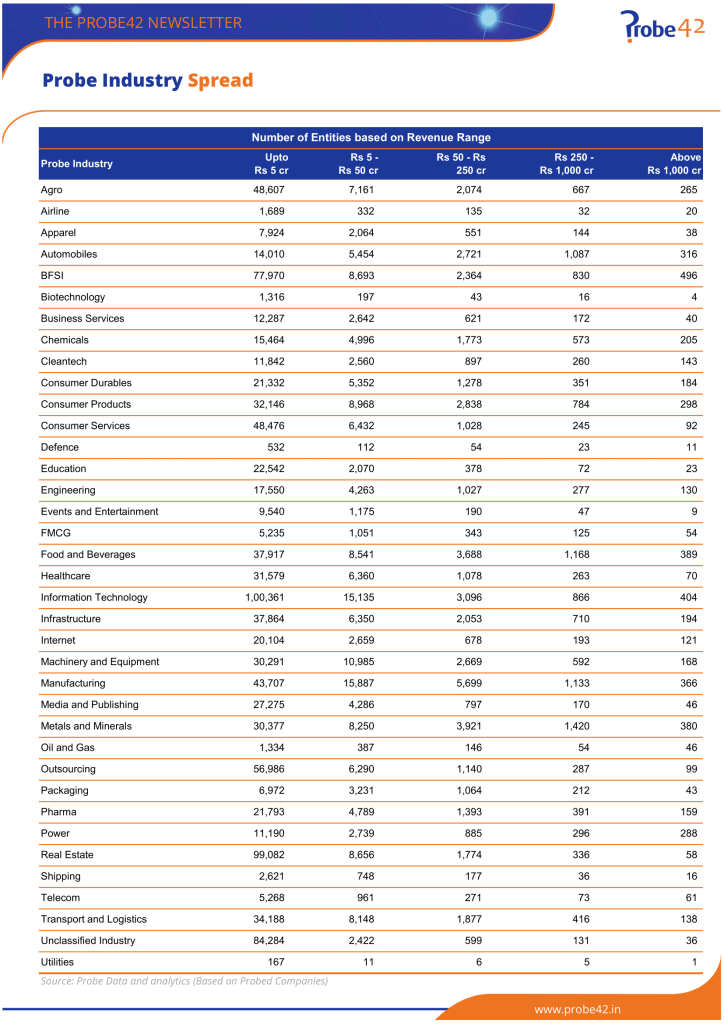
Top Probe Industries by Revenue Category:
- Upto ₹5 cr: Information Technology (1,00,361), Real Estate (99,082), BFSI (77,970), Outsourcing (56,986), Agro (48,607).
- ₹5–50 cr: Manufacturing (15,887), Information Technology (15,135), Machinery & Equipment (10,985), Consumer Products (8,968), BFSI (8,693).
- ₹50–250 cr: Manufacturing (5,699), Metals & Minerals (3,921), Food & Beverages (3,688), Information Technology (3,096), Consumer Products (2,838).
- ₹250–1,000 cr: Metals & Minerals (1,420), Food & Beverages (1,168), Manufacturing (1,133), Automobiles (1,087), Information Technology (866).
- Above ₹1,000 cr: BFSI (496), Information Technology (404), Food & Beverages (389), Metals & Minerals (380), Manufacturing (366).